3D Diagram
Purpose: Learn to calculate a 3D diagram. In this example, 3D diagram is calculated for a hypothetical ternary system
Module: PanPhaseDiagram
Thermodynamic Database: ABC.tdb
Batch file: Example_#1.17.pbfx
Calculation Procedures:
-
Load ABC.tdb following the procedure in Pandat User's Guide: Load Database , and select all three components;
-
Perform phase projection following the procedure in Pandat User's Guide: Phase Projection ;
-
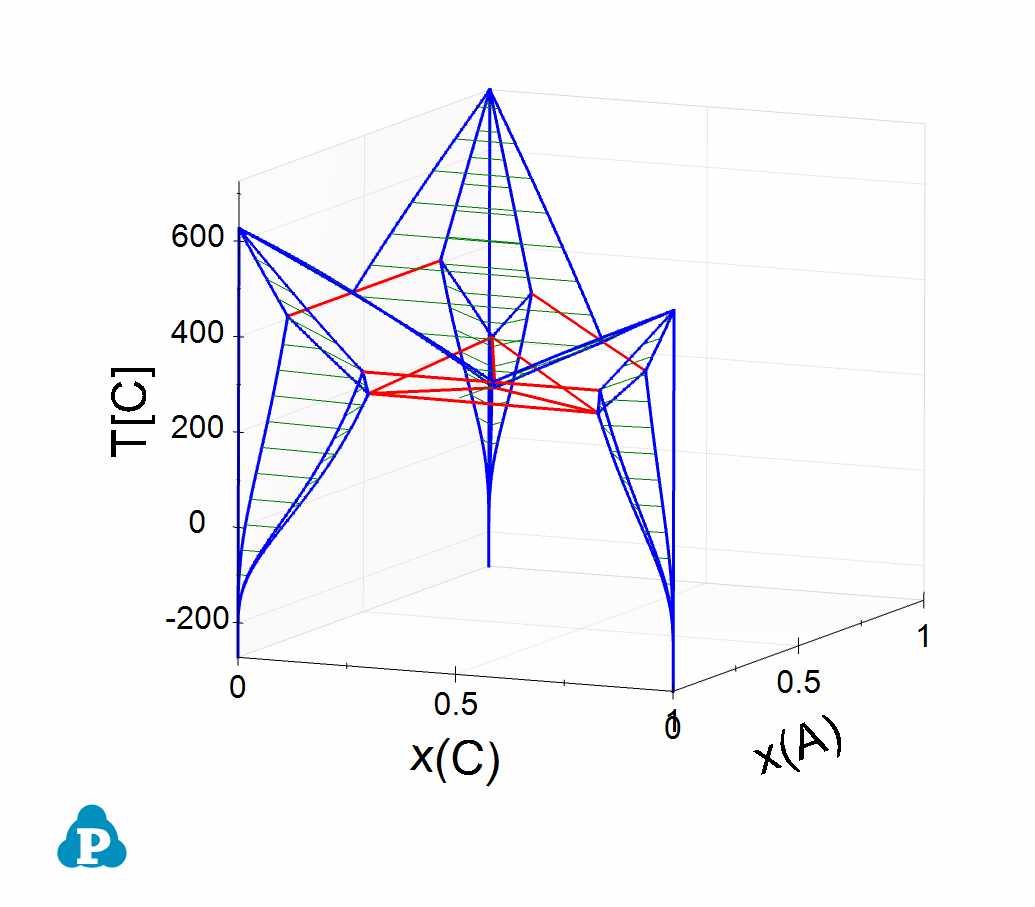
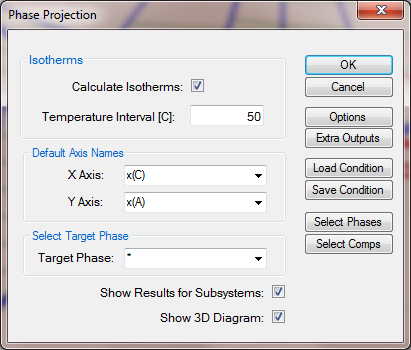
Set calculation condition as shown in Figure 1. From this setting, * is selected as Target Phase which means all the phases in the system are selected in the calculation.
Post Calculation Operation:
-
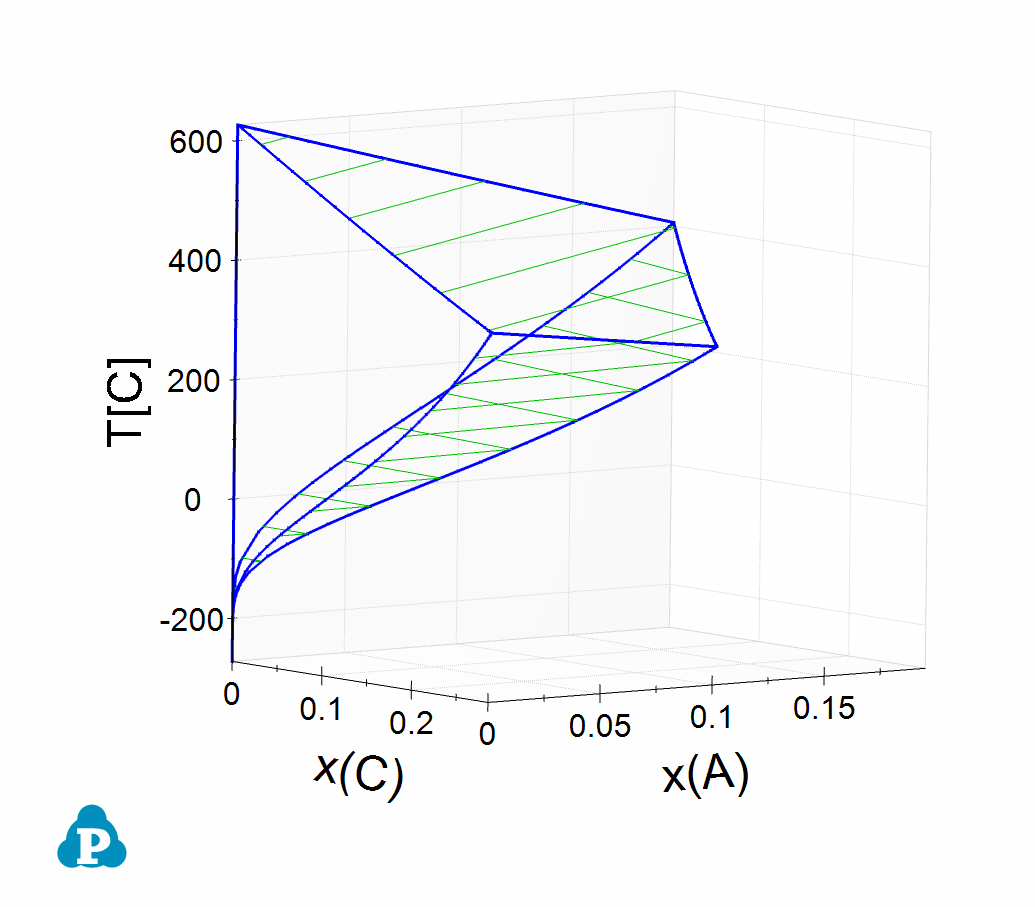
In the Property window, under "4: Invariant Tieline Property", choose “True” for the "Show Invariant Tieline", the invariant reaction lines in the three binaries as well as in the ternary will be shown (Figure 2);
-
Rotate the 3D diagram to a position you like;
-
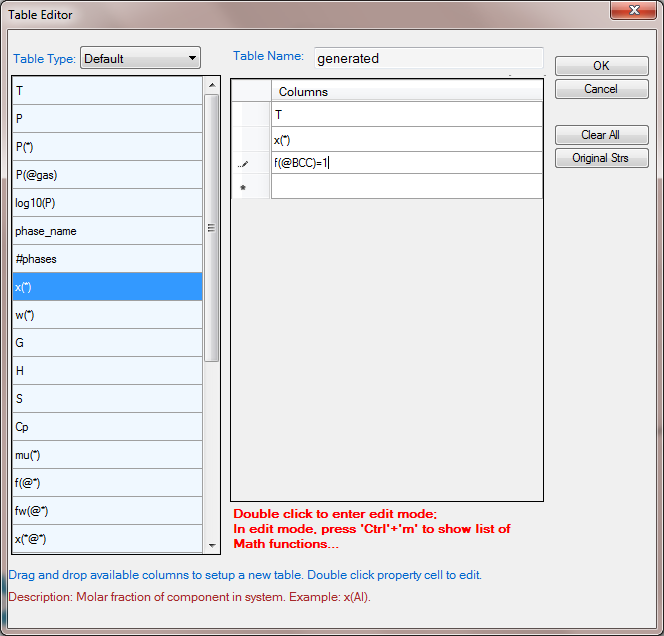
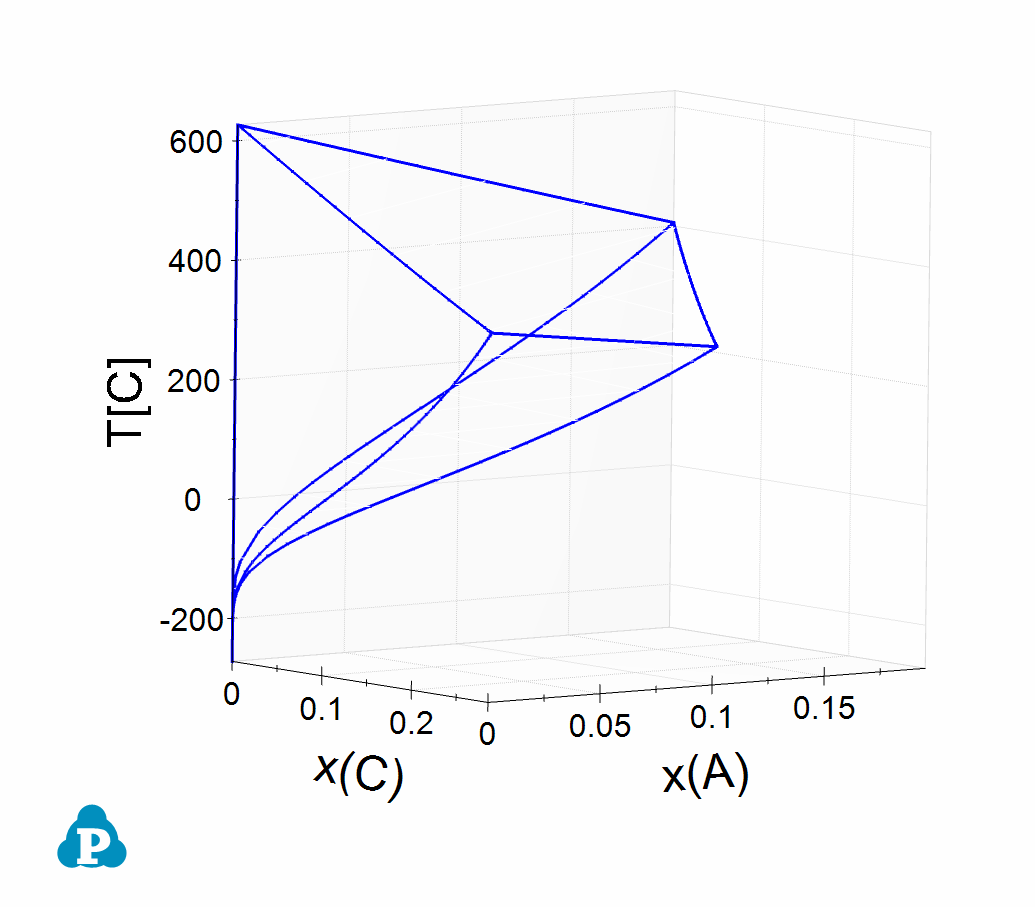
Add a new Table as shown in Figure 3 to get the phase boundary data just for the BCC phase. Select x(C) as x-axis by selecting this column first, then press Ctrl and select x(A) as y-axis, then press Ctrl and select T as z-axis, plot 3D diagram as shown in Figure 4;
-
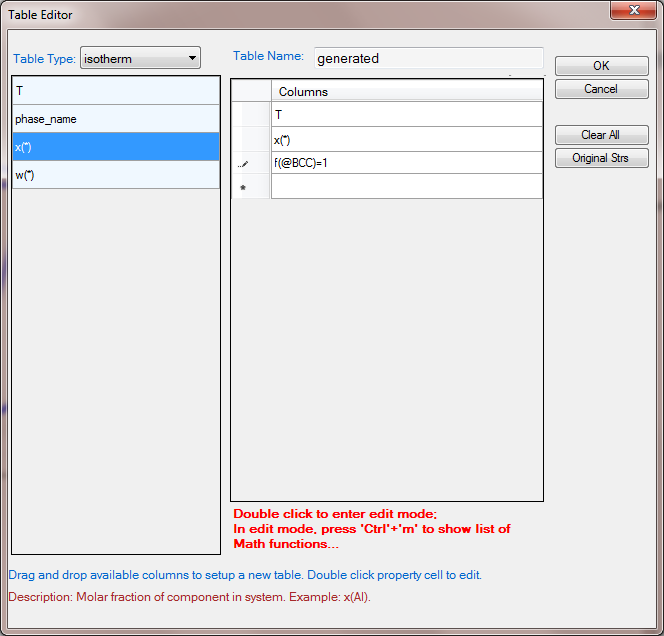
Add a new Table as shown in Figure 5 to get the isothermal lines just for the BCC phase, notice that the Table Type must be “isotherm”;
-
Double click to open the 3D diagram for BCC (Figure 4), single click the table name for the isothermal lines. From the Property window, drag in x(C) first, then press Ctrl and drag in x(A), then press Shift and drag in T, the isothermal lines for the BCC phase will be plotted on it as shown in Figure 6;